What is Phylogeny?
In the broadest sense, Phylogeny is a representation of the evolutionary relationships among various biological species [1]. Phylogeny can apply to both physical macroscopic features such as limbs, but also that of genes or proteins. There are various methods to determine a degree of relationships between homologous genes, and this can be used to create phylogenetic trees.
Phylogenetic trees depict relationships between species over time. As seen in figure 1, the root depicts a common ancestor of the human, mouse, and fly. Each node represents a speciation event, were one common ancestor splits into two or more new species. The length of each branch often represents the time and is determined by how many mutations have occurred over a given time period.
Phylogenetic trees depict relationships between species over time. As seen in figure 1, the root depicts a common ancestor of the human, mouse, and fly. Each node represents a speciation event, were one common ancestor splits into two or more new species. The length of each branch often represents the time and is determined by how many mutations have occurred over a given time period.
Figure 1. Phylogenetic tree terminology
Methods for Constructing a Tree [2]
Maximum Liklihood
In this method, an initial tree is first built using a fast but suboptimal method such as Neighbor-Joining, and its branch lengths are adjusted to maximize the likelihood of the data set for that tree topology under the desired model of evolution.
Average Distance
The Average Distance method determines the most closely related species through similarity scores and joins them with equal branch lengths. This means that the method assumes that both species have diverged equally from the common ancestor.
Neighbor Joining
The Neighbor Joining method uses BLOSSUM matrixes or percent identity to determine similarity scores and then determines most similar relationships. Unlike average distance, this method does not assume that the species have diverged equally. This methods makes some adjustments to matrix scores and then makes weighted determinations of branch lengths before drawing the tree.
Steps for Constructing a Phylogenetic Tree
Find Sequences
Homologs of interest are identified and into a plain text (txt) Fasta formatted file. The file used to construct the trees below is attached here.
| human_alk_orthologues.txt |
Perform Alignment
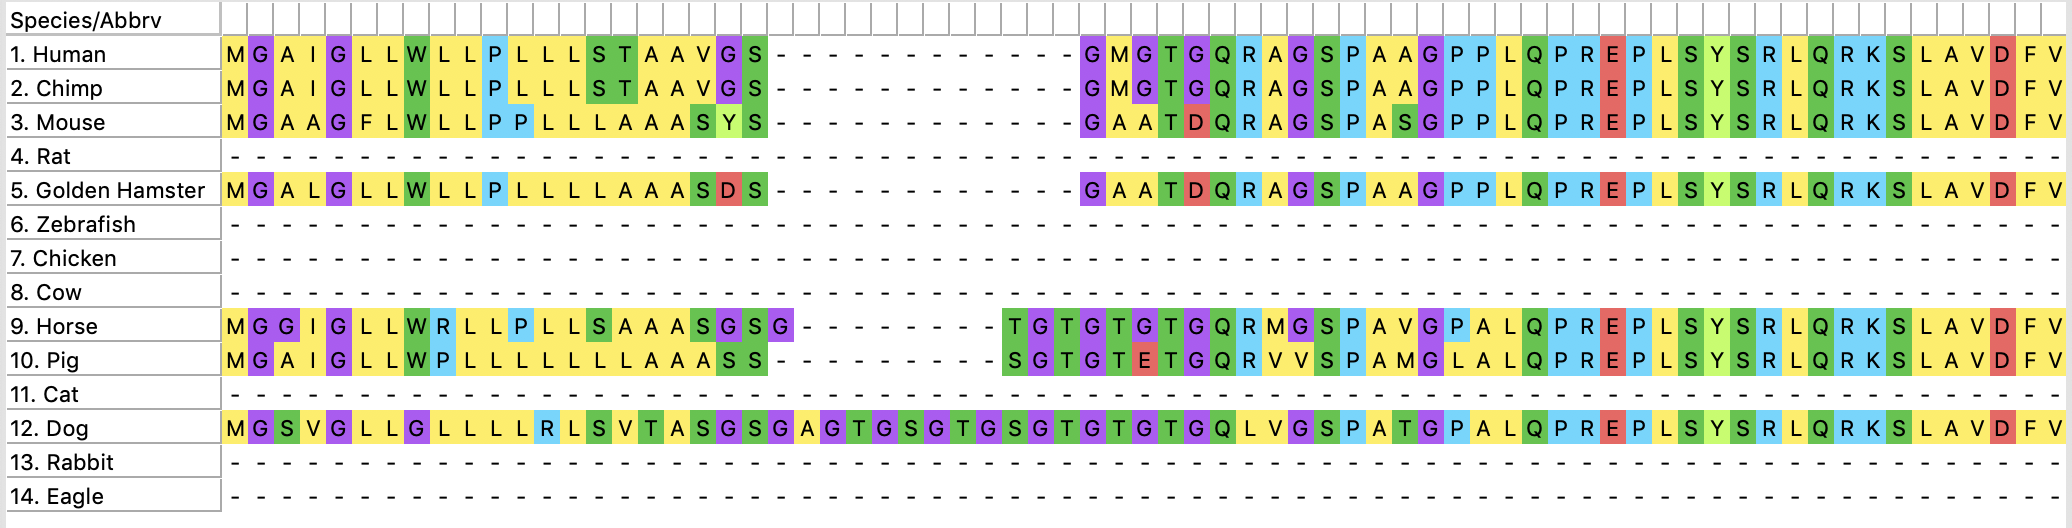
Sequences of interest then are aligned in programs such as Clustal Omega or MEGA. Included in the image below is the aligned sequences of organisms used for this tree. This algorithms maximizes similarities between sequences and aligns them.
Construct Trees
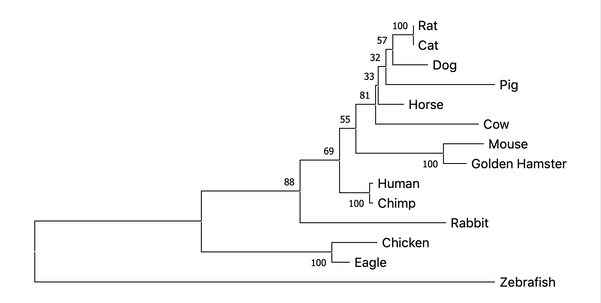
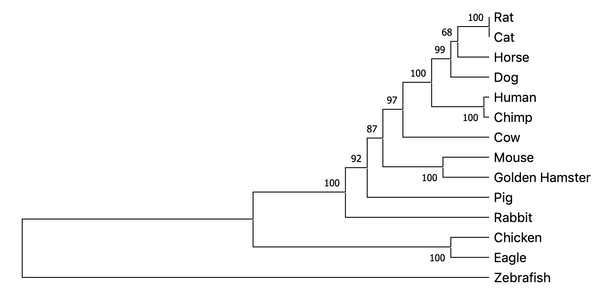
Using these aligned sequences, trees can then be determined through the methods outlined above. Each methods outcome is displayed below.
Maximum Liklihood
Average Distance
Neighbor Joining
Discussion
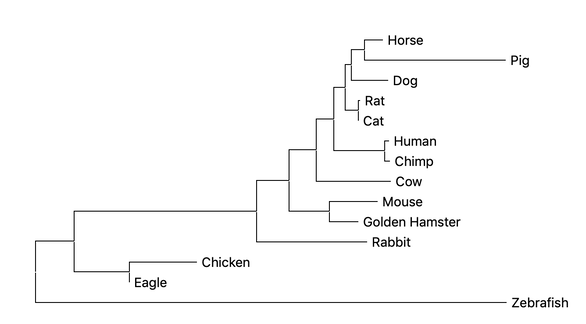
All three methods of constructing a phylogenetic tree result in very similar groupings with few differences. This indicates that the protein has a conserved function over time. This makes sense because all organisms have proliferation and survival pathways that ALK is involved in. Model organisms such as Zebrafish appear the most different from the human, while mouse appears to be the most closely related.
References
[1] https://www.ebi.ac.uk/training/online/course/introduction-phylogenetics/what-phylogeny
[2] https://www.ncbi.nlm.nih.gov/pubmed/15639989
[2] https://www.ncbi.nlm.nih.gov/pubmed/15639989
